
Expected Value in NFL Betting: How to Calculate +EV Wagers
 Available in US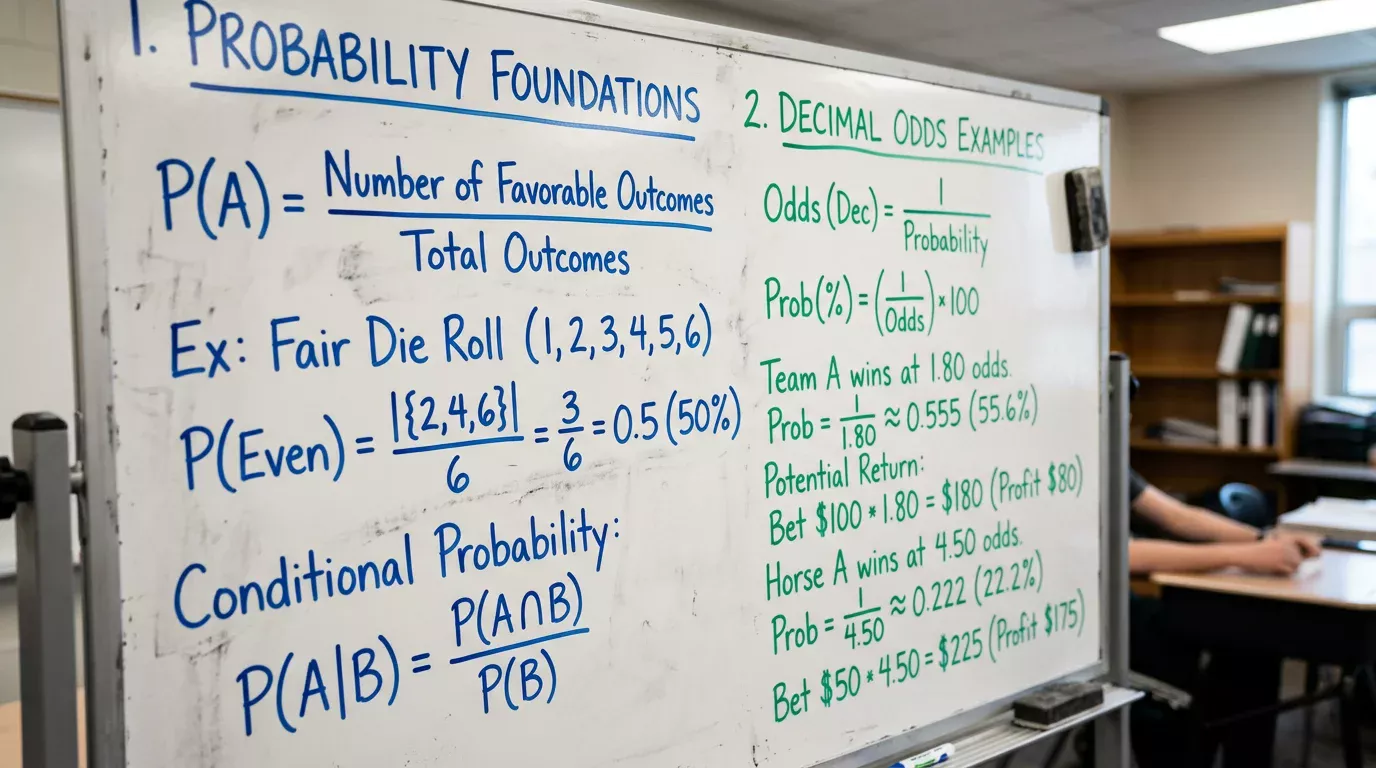
Every profitable bet I’ve ever placed has one thing in common. It’s not the sport, the market, or the bookmaker. It’s positive expected value. Every losing strategy I’ve ever abandoned has one thing in common too — negative expected value, disguised by short-term variance that made it feel profitable for a while. Expected value is the single concept that separates gambling from investing, and if you take nothing else from my work, take this: learn EV, calculate it for every bet, and never place a wager where the number is negative. Everything else in NFL betting — systems, filters, line shopping, bankroll management — exists in service of finding and exploiting +EV opportunities.
The break-even win rate at standard -110 juice (1.91 decimal) is 52.38%. That number is an EV boundary: at exactly 52.38% win rate on 1.91 odds, your expected value per bet is zero. Every percentage point above that threshold generates positive EV; every point below generates negative EV. The difference between a 53% bettor and a 57% bettor isn’t 4 percentage points of accuracy — it’s the difference between marginal profit and a genuinely sustainable operation. EV quantifies that difference precisely.
The EV Formula: Three Scenarios in Decimal Odds
Expected value is one of the simplest formulas in betting, and that simplicity is its power. EV = (Probability of Winning x Profit if You Win) – (Probability of Losing x Stake). In decimal odds, this translates to: EV = (P x (Decimal Odds – 1)) – ((1 – P) x 1), where P is your estimated true probability of the outcome and 1 represents a normalised stake.
Let me walk through three NFL scenarios that I encounter regularly.
Scenario one: a standard spread bet. You’re taking an underdog at +3.5 with decimal odds of 1.91. Your model estimates a 54% probability of covering. EV = (0.54 x 0.91) – (0.46 x 1) = 0.4914 – 0.46 = +0.0314. That’s +3.14 pence per pound staked. On a £10 bet, the expected profit is 31.4p. Over 100 such bets, the expected profit is £31.40. It sounds small — and it is small per bet. But cumulative +EV across hundreds of bets is how every profitable bettor I know generates returns. The edge is in the repetition, not the individual outcome.
Scenario two: an underdog moneyline. You’re taking a +6.5 underdog on the moneyline at 3.40 decimal. Your model estimates a 35% probability of winning outright. EV = (0.35 x 2.40) – (0.65 x 1) = 0.84 – 0.65 = +0.19. That’s +19 pence per pound staked — significantly higher EV per bet than the spread example, but with a lower hit rate and higher variance. The EV calculation doesn’t just tell you whether a bet is profitable; it tells you how profitable, which lets you compare across bet types and allocate your bankroll to the highest-EV spots.
Scenario three: a totals bet that your model flags as marginal. You’re taking the under at 43.5 with decimal odds of 1.95. Your model estimates a 53% probability. EV = (0.53 x 0.95) – (0.47 x 1) = 0.5035 – 0.47 = +0.0335. Positive, but just barely. This is a bet I’d take if it’s one of three qualifying plays on the slate, but I wouldn’t build my week around it. The EV calculation gives me the information I need to prioritise: in a week with five qualifying bets, I want to be fully deployed on the high-EV plays and comfortable passing on the marginal ones if my bankroll is constrained.
Finding EV in NFL Markets: Where the Gaps Appear
Calculating EV is straightforward. The hard part is estimating the true probability that feeds the formula. Every EV calculation is only as good as your probability estimate, and probability estimation is where the analytical work of NFL betting actually lives.
Corey Shank’s academic research across 14 NFL seasons identified profitable strategies on spread and totals markets with win rates around 57%. That 57% wasn’t plucked from thin air — it was derived from a model built on divisional rivalry patterns, market inefficiency analysis, and multi-season backtesting. The model generated probability estimates for each qualifying game, those estimates were compared to the bookmaker’s implied probability, and bets were placed only when the gap was large enough to generate meaningful +EV.
The bookmaker’s implied probability comes directly from the odds. At 1.91 decimal, the implied probability is 1 / 1.91 = 52.4%. If your model says the true probability is 56%, the gap is 3.6 percentage points. That gap is your edge. Multiply the gap by the number of qualifying bets per season, and you have your expected annual return before variance.
The most common sources of probability estimation for NFL bettors fall into three categories. Power ratings — numerical rankings of team strength that generate predicted margins of victory, which convert to win probabilities. Statistical models — regression or machine learning approaches that use historical data (EPA, DVOA, pace, injuries) to predict outcomes. And situational analysis — filters like “divisional home underdog in a low-total game” that identify historical subsets where the ATS rate significantly exceeds the break-even threshold. Each approach has strengths and weaknesses, and I use elements of all three in my own framework.
The gap between your probability and the bookmaker’s implied probability isn’t static — it shifts throughout the week as the line moves. This is why line shopping matters so much in the EV framework. If the spread moves from -3 to -3.5 during the week, the implied probability on the underdog shifts from roughly 52.4% to 51.8%. If your estimated probability hasn’t changed, the EV of betting the underdog has increased. Capturing that extra 0.6 percentage points through timing or multi-bookmaker comparison translates directly into higher per-bet EV.
EV Tracking Over Time: When the Law of Large Numbers Kicks In
Here’s the uncomfortable truth about expected value: it tells you nothing about any single bet. A +EV bet can lose. A -EV bet can win. EV is a property of the process, not the outcome. The law of large numbers guarantees that actual results converge toward expected results as the sample grows — but “large numbers” in NFL betting means hundreds of bets, not dozens.
My minimum threshold for evaluating a system’s EV is 500 bets. Below that, variance dominates the results to such a degree that you can’t distinguish a +3% EV system from a -1% EV system with any confidence. At 200 bets, the confidence interval around your observed win rate is wide enough to include both profitable and unprofitable scenarios. At 500 bets, the interval narrows enough to draw meaningful conclusions. At 1,000 bets, you can be reasonably confident that your observed results reflect your true EV rather than luck.
This has practical implications for how I manage my betting framework. A new system doesn’t earn full unit allocation until it’s passed the 200-bet mark with a positive EV trajectory. Between 0 and 200 bets, I run new systems at half-unit size — enough to generate real data, small enough that a failed system doesn’t damage my bankroll. Between 200 and 500 bets, I scale to full units if the EV trajectory remains positive. Only after 500 bets do I have enough confidence to increase unit size or allocate more aggressively.
I track EV alongside win rate because the two metrics tell different stories. Win rate is a lagging indicator — it tells you what has happened. EV, when estimated from your probability model rather than observed results, is a leading indicator — it tells you what should happen. A system producing +EV bets that’s running below its expected win rate is experiencing negative variance, not structural failure. A system producing -EV bets that’s running above its expected win rate is borrowing from the future. The distinction matters enormously for decision-making: the first system should be continued with confidence; the second should be retired before the variance corrects.
Expected value is where everything in this framework connects. Closing line value is a proxy for EV — bettors who consistently beat the closing line are consistently finding +EV. Bankroll management is the discipline of sizing bets proportionally to EV magnitude. Line shopping increases per-bet EV by capturing better prices. Backtesting validates whether a system’s historical EV is positive and robust. Every concept I’ve covered across these guides feeds into a single objective: placing bets where the expected value is positive and avoiding everything else. Master that, and the rest is arithmetic and patience.
How do I calculate expected value for an NFL bet using decimal odds?
The formula is: EV = (Your Estimated Probability x (Decimal Odds – 1)) – ((1 – Your Estimated Probability) x 1). For example, if you estimate a 55% chance of covering the spread at 1.91 decimal odds: EV = (0.55 x 0.91) – (0.45 x 1) = 0.5005 – 0.45 = +0.0505, or +5.05p per pound staked. Positive EV means the bet is profitable in the long run; negative EV means it loses money over time. The critical input is your probability estimate — the formula is only as useful as the probability feeding it, which is why model quality, backtesting, and situational analysis are essential.
How many bets are needed before expected value reliably predicts profit?
A minimum of 500 bets is needed before you can draw reliable conclusions about whether a system’s expected value is genuinely positive. Below 200 bets, variance is dominant enough that a -EV system can appear profitable and a +EV system can appear unprofitable. Between 200 and 500 bets, the confidence interval narrows but is still wide enough for ambiguity. Beyond 500 bets, observed results begin to converge reliably toward true EV, allowing you to assess system performance with reasonable confidence. For practical purposes, this means a new NFL system needs at least 3-4 full seasons of live tracking before you can evaluate its profitability with high certainty.
Prepared by the nfl Betting Systems editorial staff.